When writing our 2021 asset allocation in December 2020, we forecasted that the overwhelming directive force of financial markets would be determined by POLICY rather than FUNDAMENTALS.
We capitalise both those words because they are both memes – an element of a culture imitated by other means.
This is where POLICY is the culmination of government and central bank stimulus, while FUNDAMENTALS refers to traditional valuation metrics for financial markets, including economic data, accounting ratios and mean-reversion measures for market distortions.
As for our prognosis?
So far so good, where POLICY has remained the primary driver of financial markets, which become quiet before large government policy events – such as central bank meetings and government budget updates – waiting with bated breath for the news of never-ending stimulus.
In this regard, financial markets have got their wish, with multiple countries such as the US and Australia projecting budget deficits for the coming ten years.
As you can imagine, given our initial projection, we have closely tracked these POLICY updates and detailed them within past morning notes:
- 7 July, RBA takes their foot off the gas, slightly
- 28 June, USA Budget deficit spending and unorthodox economic spending
- 7 June, RBA policy framework for 2021
- 14 May, Australian Federal Budget review
- 26 April, USA “Build Back Better” spending plans
- 2 February, State of the Australian economy
Why does POLICY matter so much?
The POLICY meme matters so much to our asset allocation framework because it is the catalyst for financial market price impulses.
Hence, we would be crazy to ignore the #1 driver of financial markets this year, and not recognise it within our framework.
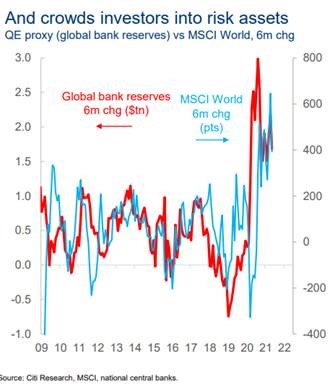
For example, we can analyse specific market situations such as the rate of change of global central bank reserves (their balance sheet size) compared to the change in price of MSCI World equity index and find a close alignment.
It would be no surprise then that when central banks increase their balance sheet, equity market assets generally do well as better and easier financial conditions support prices.
You can take this relationship one step further, where we can then measure the difference between corporate earnings and equities prices (the below chart), or as Max penned within his Friday morning note, we can also measure when stock market capitalisations rise faster than economic output (GDP).
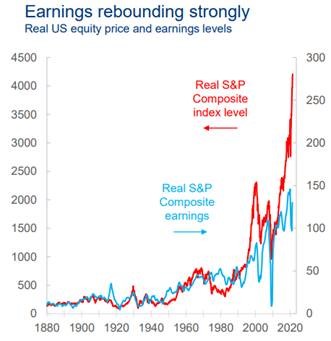
Source: Citi Research
Looking at this econometrically, we find statistical relevance when comparing our contemporary economy to socialised economies of the US during the Korean War, or to a lesser extent, to the policy impact within the USSR’s internal economics.
In this way, we are analysing the impact of previous periods of economic stimulus and using this as scenario analysis for our current economic conditions.
However, this only works to an extent as the measure of stimulus within the current economy is unprecedented when aggregating the impact of all POLICY, from both government and central banks.
While governments have transacted similar levels of stimulus in WWII, they did not have the same aggregate level of spending because the central bank component was missing.
This is how “this time is different”, and how POLICY allows asset prices to become overvalued above FUNDAMENTAL levels.
Other Macroeconomic Variables
While the POLICY versus FUNDAMENTALS dichotomy explains a large part of financial asset movements, it is by no means the be-all and end-all factor.
Inflation data – calculating the general increase in prices of goods and services – also has played a massive part of the market paradigm and whether the price increases are transitory in nature due to supply bottlenecks, or they are permanent.
So far, inflation has been mostly in transitive areas of goods prices, rather than services prices, and world-wide there’s little sustained wage inflation to be seen.
Otherwise, consumer confidence and national savings rates are also bouncing around, which has been a function of rolling lockdowns, vaccination hesitancy and inability to play expenditure for the future, given the unknown outlook.
This has also seen a lot of money moving into unproductive expenditure – typically items that have a once off value add and do not increase future economic productivity. This also reinforces the transitive element to inflationary pressures.
Asset Allocation Update
This POLICY framework creates the conditions that allows for a “risk on” investing environment.
An environment where risk assets – those most sensitive to economic growth and future corporate earnings and consumption spending – can out-perform “risk off” assets such as safe haven currencies, precious metals, and government bonds.
Armed with this knowledge alone, you would likely have designed appropriate investment portfolios this year, to take advantage of a pro-cyclical, pro-growth economic climate.
Main Asset Class Summaries –
Below are our high-level summaries of broad asset classes:
Equities – positive
In 2021, equity markets have a positive impulse because of continued government and central bank policy support, improved corporate earnings (off a low base), and the positive sentiment associated with reopening economics, as consumption behaviour returns somewhat, depending on the country.
In H1 this year we tilted towards lowly valued areas within equity markets (“value”), though this was a tilt and not a large change in our asset allocation (AA) framework.
This particular trend has mostly played out, as bond yields are not moving higher and inflation forecasts are now being wound back, and we rotate (tilt) more towards “growth” rather than value yet again.
This asset class is also heavily exposed to liquidity, a function of central bank stimulus, and borrowing costs (bond yields), affecting valuations.
Equities are also a very thematic asset class right now, where we can gain sectoral exposure to emerging consumer trends, a few example below that should remain relevant:
- 2 July, investing in equity exchanges
- 1 July, eSports and online gaming
- 29 June, sustainable food
- 24 June, 3D printing
- 10 June, Australian resource companies
- 3 June, aged care
Government bonds – neutral/negative
Because the current inflationary impulse does seem transitory in nature – where supply pressures should abate within the next 6-24 months – this has seen us become less negative on government bonds, where previously we were worried about higher long term bond yields (prices lower, yields higher).
As such, we have become more neutral on government bonds, yet cannot become positive on them because most developed market government bonds are yielding less than 2% p.a., but we cannot be too negative either given the amount of central bank support they are receiving, through asset purchase programs.
We utilise government bonds within portfolios for several reasons – typically for income, diversification, and liquidity.
At present, government bonds provide diversification and liquidity but are lacking in terms of income – where in the below chart we depict the current government bond yield curve (green) versus the same yield curve 12 months ago.
An investor buying 6-10y government bonds would only expect a return (yield to maturity) of 1-1.4% per annum, buying and holding these bonds.
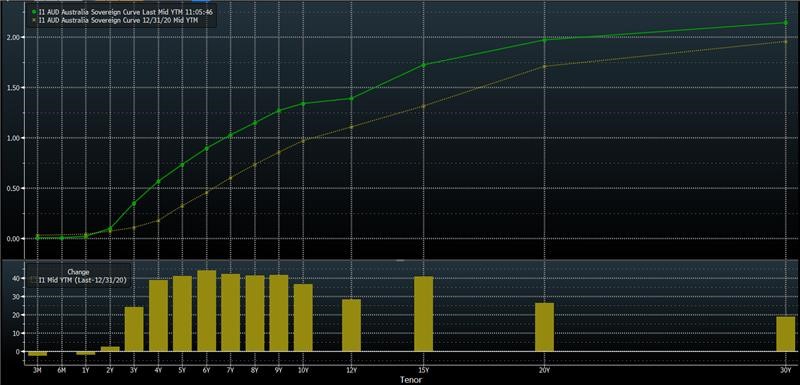
Source: Bloomberg
This dynamic makes it hard to be positive on government bonds unless we were seeking risk-off assets.
Investment Grade Credit bonds – positive/neutral
In terms of global credit, we remain positive for similar reasons as our equity market summary, because of low default rates and increased corporate earnings supporting debt serviceability.
IG credit bonds are also the recipient of fund flows where investors have rotated from government bond exposure to a larger credit bond exposure, in search of higher income levels.
This has been playing out amidst the backdrop of a large demographic, the Baby Boomer generation, are retiring and transitioning to more defensive assets (from equities to fixed income).
We do note that because of the POLICY initiatives, particularly from central banks, this has caused dislocations within credit markets where some areas of the market offer little credit premium and are thus similar to government bond yields but with less diversification and liquidity.
These are not the areas of corporate credit that we are positively inclined towards.
Instead, we seek to take advantage of primary markets and new deal concessions – a facet of the Mason Stevens Credit Fund’s consistent out-performance as a managed fund – and also subordinated debt and private credit, where we can receive additional yield through “complexity premia”, because of our team’s robust knowledge of debt capital markets.
On a more generalised basis, we acknowledge that credit spreads are near all-time tights, and remain positive/neutral on credit because we are tactically allocating to specific parts of the asset class.
As this is a particular asset class that we have an affinity for, we’ve written many notes providing regular updates as well:
- 5 July, how governments can take advantage of “lower for longer” interest rates
- 25 June, getting long duration as a risk-off play
- 9 June, building better portfolios using bonds
- 28 April, how to use inflation-linked bonds
- 8 March, the differences between corporate bonds
Commodities – positive
We remain positive on commodities because global supply remains under pressure as inventories have plummeted to decade lows.
We’ve written notes on this more than ever, given commodities have enjoyed a rare bull market across the spectrum:
- 13 May, Industrial metals
- 7 May, Agricultural commodities
- 6 May, Precious metals
- 3 May, lumber/timber
As northern hemisphere economies reopen during their warmer months, we should see a continued increase in demand where supply slowly comes back online.
This dislocation should benefit commodity producers and commodity prices in the next 1-6 months and should be considered a tactical allocation.
As part of our original 2021 outlook, we sought to be positively exposed to uranium, copper, and iron ore as our commodity proxies.
Uranium was one that particularly interested clients, because it is an exposure that is traditionally vastly underweighted by investment portfolios.
To proxy this, look no further than the likes of Cameco (NYSE: CCJ), the world’s largest publicly traded uranium producer, that doubled in price over the last year.
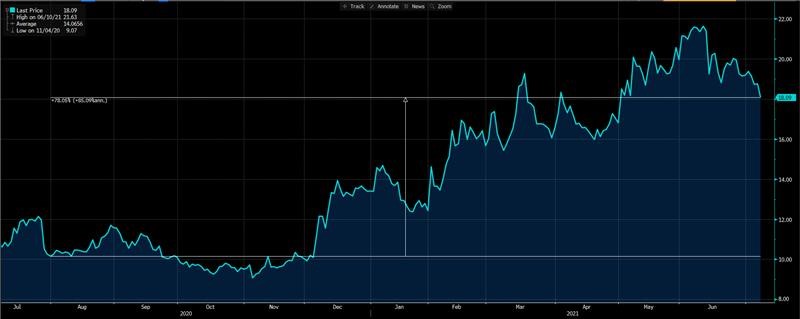
Source: Bloomberg
As precious metals form part of the commodity spectrum, it is worth noting that we are neutral/negative on assets such as gold because of the risk-on backdrop.
Currencies
Within this framework, risk-on currencies such as the Australian dollar (AUD, New Zealand dollar (NZD), Norwegian krona (NOK), Canadian dollar (CAD) should out-perform the likes of the Euro (EUR), Great British Pound (GBP), the Japanese yen (JPY) or the US dollar (USD).
Because of the bifurcation of countries and their currencies, we’ve also written plenty of notes to cover this asset class too:
- 23 June, buying safe-haven currencies
- 24 May, why the AUD wasn’t more highly valued
- 19 February, long term decline of the USD’s value
Part of this trade expression is that the commodity linked currencies will benefit from higher commodity prices as higher corporate earnings from miners are repatriated back to local currencies, creating a positive price impulse.
But also, these nations (Australia, NZ, Canada) are also slower in rolling out their COVID-19 vaccinations which has also seen them underperform during 2021 economically, where they may play catch-up as they improve in this regard.
One of the main downsides to this view is that the US Federal Reserve may be relatively more hawkish than other central banks because of the US vaccination performance, which may see the USD rally over the short to medium term – similarly to the 2013 “taper tantrum”.
Another downside possibility is the adverse impact of trade conflict between China and the USA (and Australia) spilling into lower growth implications for our economy because of trade restrictions.
Emerging markets – positive
The structurally weak USD because of their twin deficits – budget deficit and trade deficit – is generally positive for emerging markets as well.
For one, emerging markets have (on average) higher growth profiles ahead of them because of base effects, where their economies are less mature and have the chance to play catch-up to developed economies, harnessing technology, trade, and labour force trends in their favour.
They also tend to have younger demographic profiles and lower indebtedness, which can be a hamstring for developed economies.
This all falls within the structural trend of “demographics are destiny” which we believe is the #1 shaping force for long-term economic output, and have written about it regularly:
- Demographics are destiny
- Investing in India
- Emerging Market fixed income investing
- Investing in China, Hong Kong
- Electric vehicle usage in EM and DM
- Generational wealth transference
In aggregate, the demographic narrative is compelling, as is the low debt burdens, higher growth rates and technology utilisation.
However, we nuance this view that not ALL emerging markets are compelling, as we actively avoid markets such as South Africa, Russia, Brazil – where we have no discernible edge to investing – and allocate towards APAC EM – China, Taiwan, India, Indonesia, Malaysia – whom have stronger growth profiles.
Style Matters, not just Assets
As we seek to round-off our asset allocation update, I wish to share some of our insights that nuance the views of any asset allocation framework.
When creating such a guideline, we note that they provide a high-level strategy based on valuations, on-going momentum, and directionality.
Some of this momentum is more short-term oriented (dynamic AA) and some of it is medium to long-term (strategic AA), depending on our time horizons and portfolio mandate objectives.
We also manage the STYLE of the assets being managed as well, where we may be negatively inclined to an asset class, but positively inclined to a particular manager who manages the asset class from a contrarian view or is non-directional.
For example, we have a neutral to negative view on government bond exposure because of the asymmetric return profile but are open to investing in strategies that seek absolute returns, rather than market beta (correlation).
You would have seen an iteration of this within our credit bond AA notes, where we acknowledge that credit spreads are near all-time tights across a wide swathe of credit bonds, but if managed in a dynamic way – such as how we self-manage our credit bond exposures via our fixed income funds – we can achieve consistently high market returns, over and above the market.
Hence, asset allocation is always a guiding rubric for building portfolios, but it can’t encapsulate the entire picture we’re painting.
The views expressed in this article are the views of the stated author as at the date published and are subject to change based on markets and other conditions. Past performance is not a reliable indicator of future performance. Mason Stevens is only providing general advice in providing this information. You should consider this information, along with all your other investments and strategies when assessing the appropriateness of the information to your individual circumstances. Mason Stevens and its associates and their respective directors and other staff each declare that they may hold interests in securities and/or earn fees or other benefits from transactions arising as a result of information contained in this article.
